Get meaningful insights into your students' performances over time and over multiple assignments via Wayground. Student-level reports are especially beneficial for uncovering insights on performance over time via each formative assessment. This would allow you to plan your lessons and instructions going forward and give an actionable understanding of how every student is performing in your class.
All plans support Student Reports for Wayground Classes, and the Wayground School and District Plans support student Reports for Google Classroom, Schoology, and Canvas Classes.
To check for Longitudinal Growth Graphs on Wayground, follow these steps:
Prerequisite:
- You can check for growth graphs on completed assignments when connected to either Google Classroom, Schoology, Canvas, or Wayground Classes.
- 1. Click on the 'Students' tab on the left navigation pane, and then go to the 'Classes' section
- 2. Here, you'd be able to check for class-level and student-level reports. Click on the correct class for more details
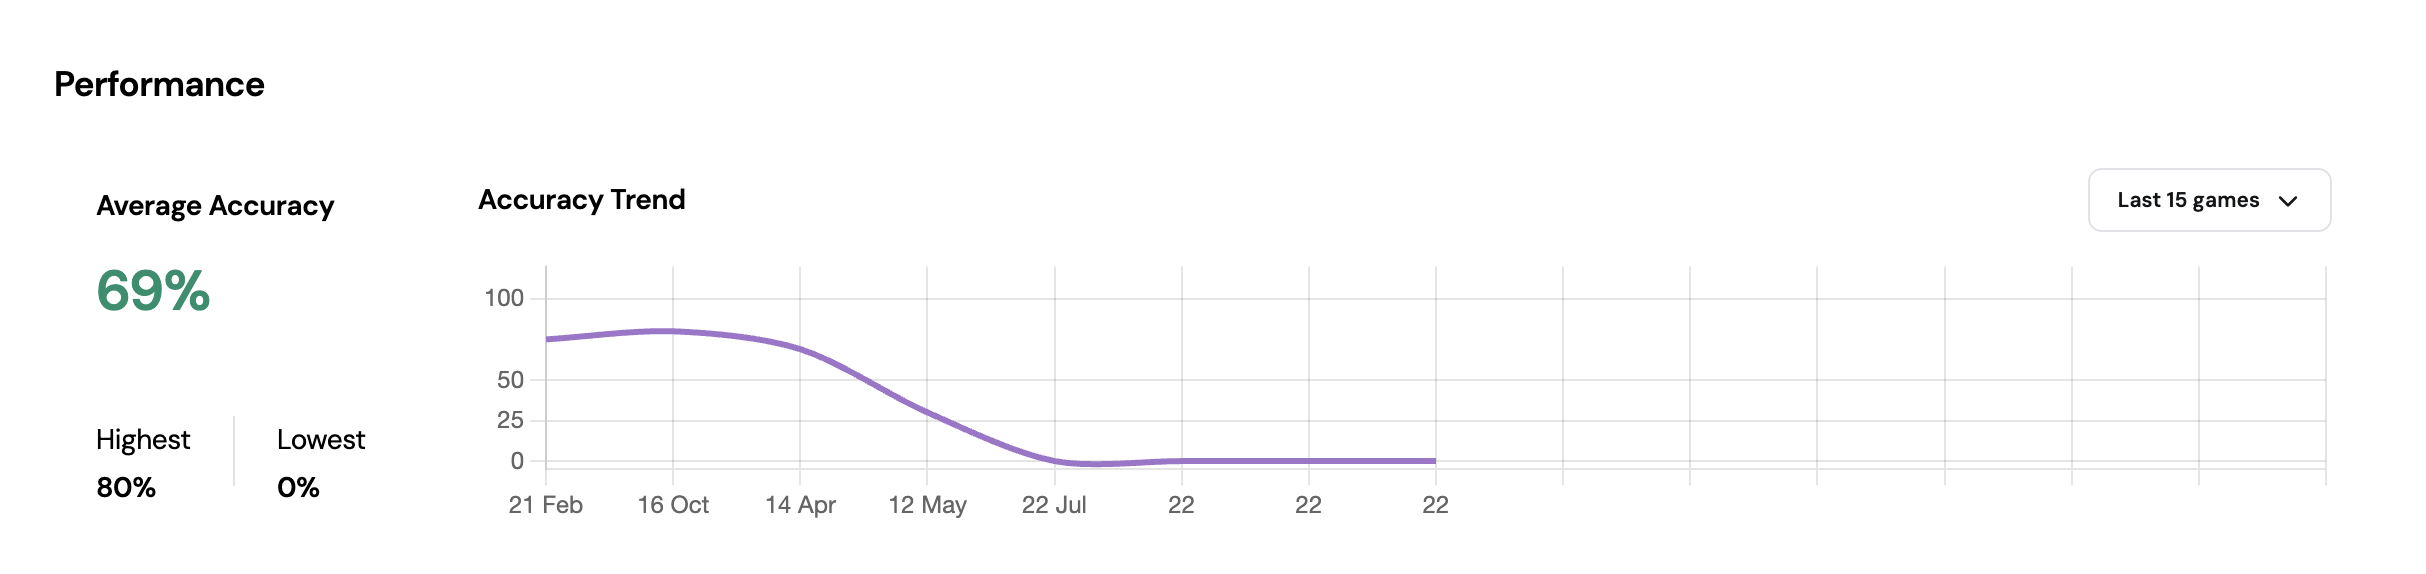
- 3. Under 'Overview', you will see the class-level performance in the Accuracy and Time graph.
- 1. If you hover over each point, you'd see the name of the Assessment/Quiz with the exact results (accuracy and the number of participants) mentioned on the right. You can click on each point to get more details about the quiz in a separate tab.
- 2. Check for a more detailed description under this graph -- you also have the option to reopen an Assessment/Quiz if required.
- 3. In case you decide to reopen an Assessment/Quiz for remedial practice, new reports are generated automatically and the growth graphs are updated when the assignment ends.
- 4. Under the 'Students' tab, you will see individual student names, Assessments/Quizzes assigned, quiz completion rate, average accuracy, and the option to view the full report per student per quiz.

Note:
In case you had enabled Redemption Quiz for your session, the Longitudinal Growth Graphs will reflect the updated scores obtained from the redemption questions.
You can access the automatically generated growth graphs of all Assessments/Quizzes (Live and Homework) played after August 2021. Growth graphs cannot be generated for Assessments/Quizzes prior to August 2021.
Was this article helpful?
That’s Great!
Thank you for your feedback
Sorry! We couldn't be helpful
Thank you for your feedback
Feedback sent
We appreciate your effort and will try to fix the article