Wayground aims to empower you with all the data you need to create effective assessments, identify gaps in learning, differentiate instruction, and support your learners on their path to mastery.
With this goal in mind, we offer detailed insights into student performance, including data on accuracy. Wayground measures accuracy levels for every activity you conduct, so you can easily monitor the growth of your classroom.
In this article, we will dive deep into how accuracy is measured on Wayground. We'll begin by understanding accuracy and how it differs from session scores.
We will then take a look at the different types of accuracy that can be tracked on Wayground: student accuracy and class accuracy. We will also discuss how each of these accuracy types is calculated.
Finally, we will explore all the avenues through which you can access accuracy data. This includes your Live Dashboard and reports.
Accuracy points vs. session scores: what is the difference?

Accuracy on Wayground is measured in points. We can think of accuracy points as the marks a student obtains for all their correct and partially correct answers.
If you have integrated Wayground with an LMS (such as Google Classroom, Schoology, or Canvas), these are the points that are synced with your LMS reports.
Session scores, on the other hand, are purely meant to increase student engagement and add an element of gamification to your sessions. They impact a student's rank on the leaderboard but are not synced with your LMS.
Session scores can be influenced by a number of factors, including the amount of time a student takes to answer a question and the Power-ups that they use.
Here's an example:
Let us say that James is attempting a Multiple-Choice question that carries two points. If he answers a question correctly, he will get two accuracy points and a session score of 600.
With the x2 Power-up, he can get twice the score if he answers the question correctly. This means that if James gets the answer right, he will be awarded two points and a score of 1200. As you can see, James' accuracy points were not affected by this Power-up. It was only his score that doubled.
Here's how we can define the differences between accuracy points and session scores:
| Points | Scores |
| Measure the accuracy of responses | Rewards the correctness of responses along with other factors |
| Cannot be influenced by time taken to answer | Can be influenced by time taken to answer |
| Cannot be influenced by Power-ups | Can be influenced by power-ups |
| Do not impact position on leaderboard | Impact position on leaderboard |
| Reflect in LMS reports | Do not reflect in LMS reports |
| Impact Longitudinal Growth Graphs | Do not impact Longitudinal Growth Graphs |
Now that we understand what accuracy is and how it differs from session scores. Let's look at the two ways in which accuracy is calculated on Wayground.
Types of accuracy and how they are calculated
Student accuracy
Student accuracy measures how accurately a particular student has answered the questions in your session. Here is how it is calculated:

Class accuracy
Class accuracy measures the accuracy of responses of the whole class.
How it’s calculated:
Wayground calculates class accuracy using the best responses for each question across all attempts made by the class. If a student has attempted the same question multiple times (for example, across different attempts), only their highest-scoring response for that question is counted. However, this calculation includes all attempts from all students; it does not select only the best attempt per student.

Accuracy with Adaptive Question Bank Mode
Wayground offers several settings to customize your activity as per your needs. Some of these settings can affect the number of times your students can attempt the questions in a session.
One such setting is the Adaptive Question Bank Mode. When this setting is enabled, your students will see a unique set of questions from your session each time they attempt it. Here's an example:
| Student Name | Question set in Attempt No. 1 | Question set in Attempt No. 2 | Question set in Attempt No. 3 |
| James | Q8, Q3, Q6 | Q3, Q2, Q7 | Q10, Q1, Q5 |
Kathy | Q4, Q10, Q7 | Q3, Q6, Q10 | Q8, Q10, Q7 |
Every question in the session might have anywhere between 0 and 20 points allotted to it. So, the maximum number of points that your students can obtain will vary from one attempt to the next.
In such cases, here is how student accuracy is calculated for a given attempt:

And here is how class accuracy is calculated for a given attempt:

Accessing accuracy data
Live Dashboard
The Live Dashboard gives you an overview of your classroom's progress in a live session. Here's an example of a Dashboard for a live session conducted in Classic mode.

The meter on top displays the class accuracy at that moment in time. The 'Score' column updates in real-time to reflect the scores obtained by your students.
Here's how your Live Dashboard might look once your session is complete.
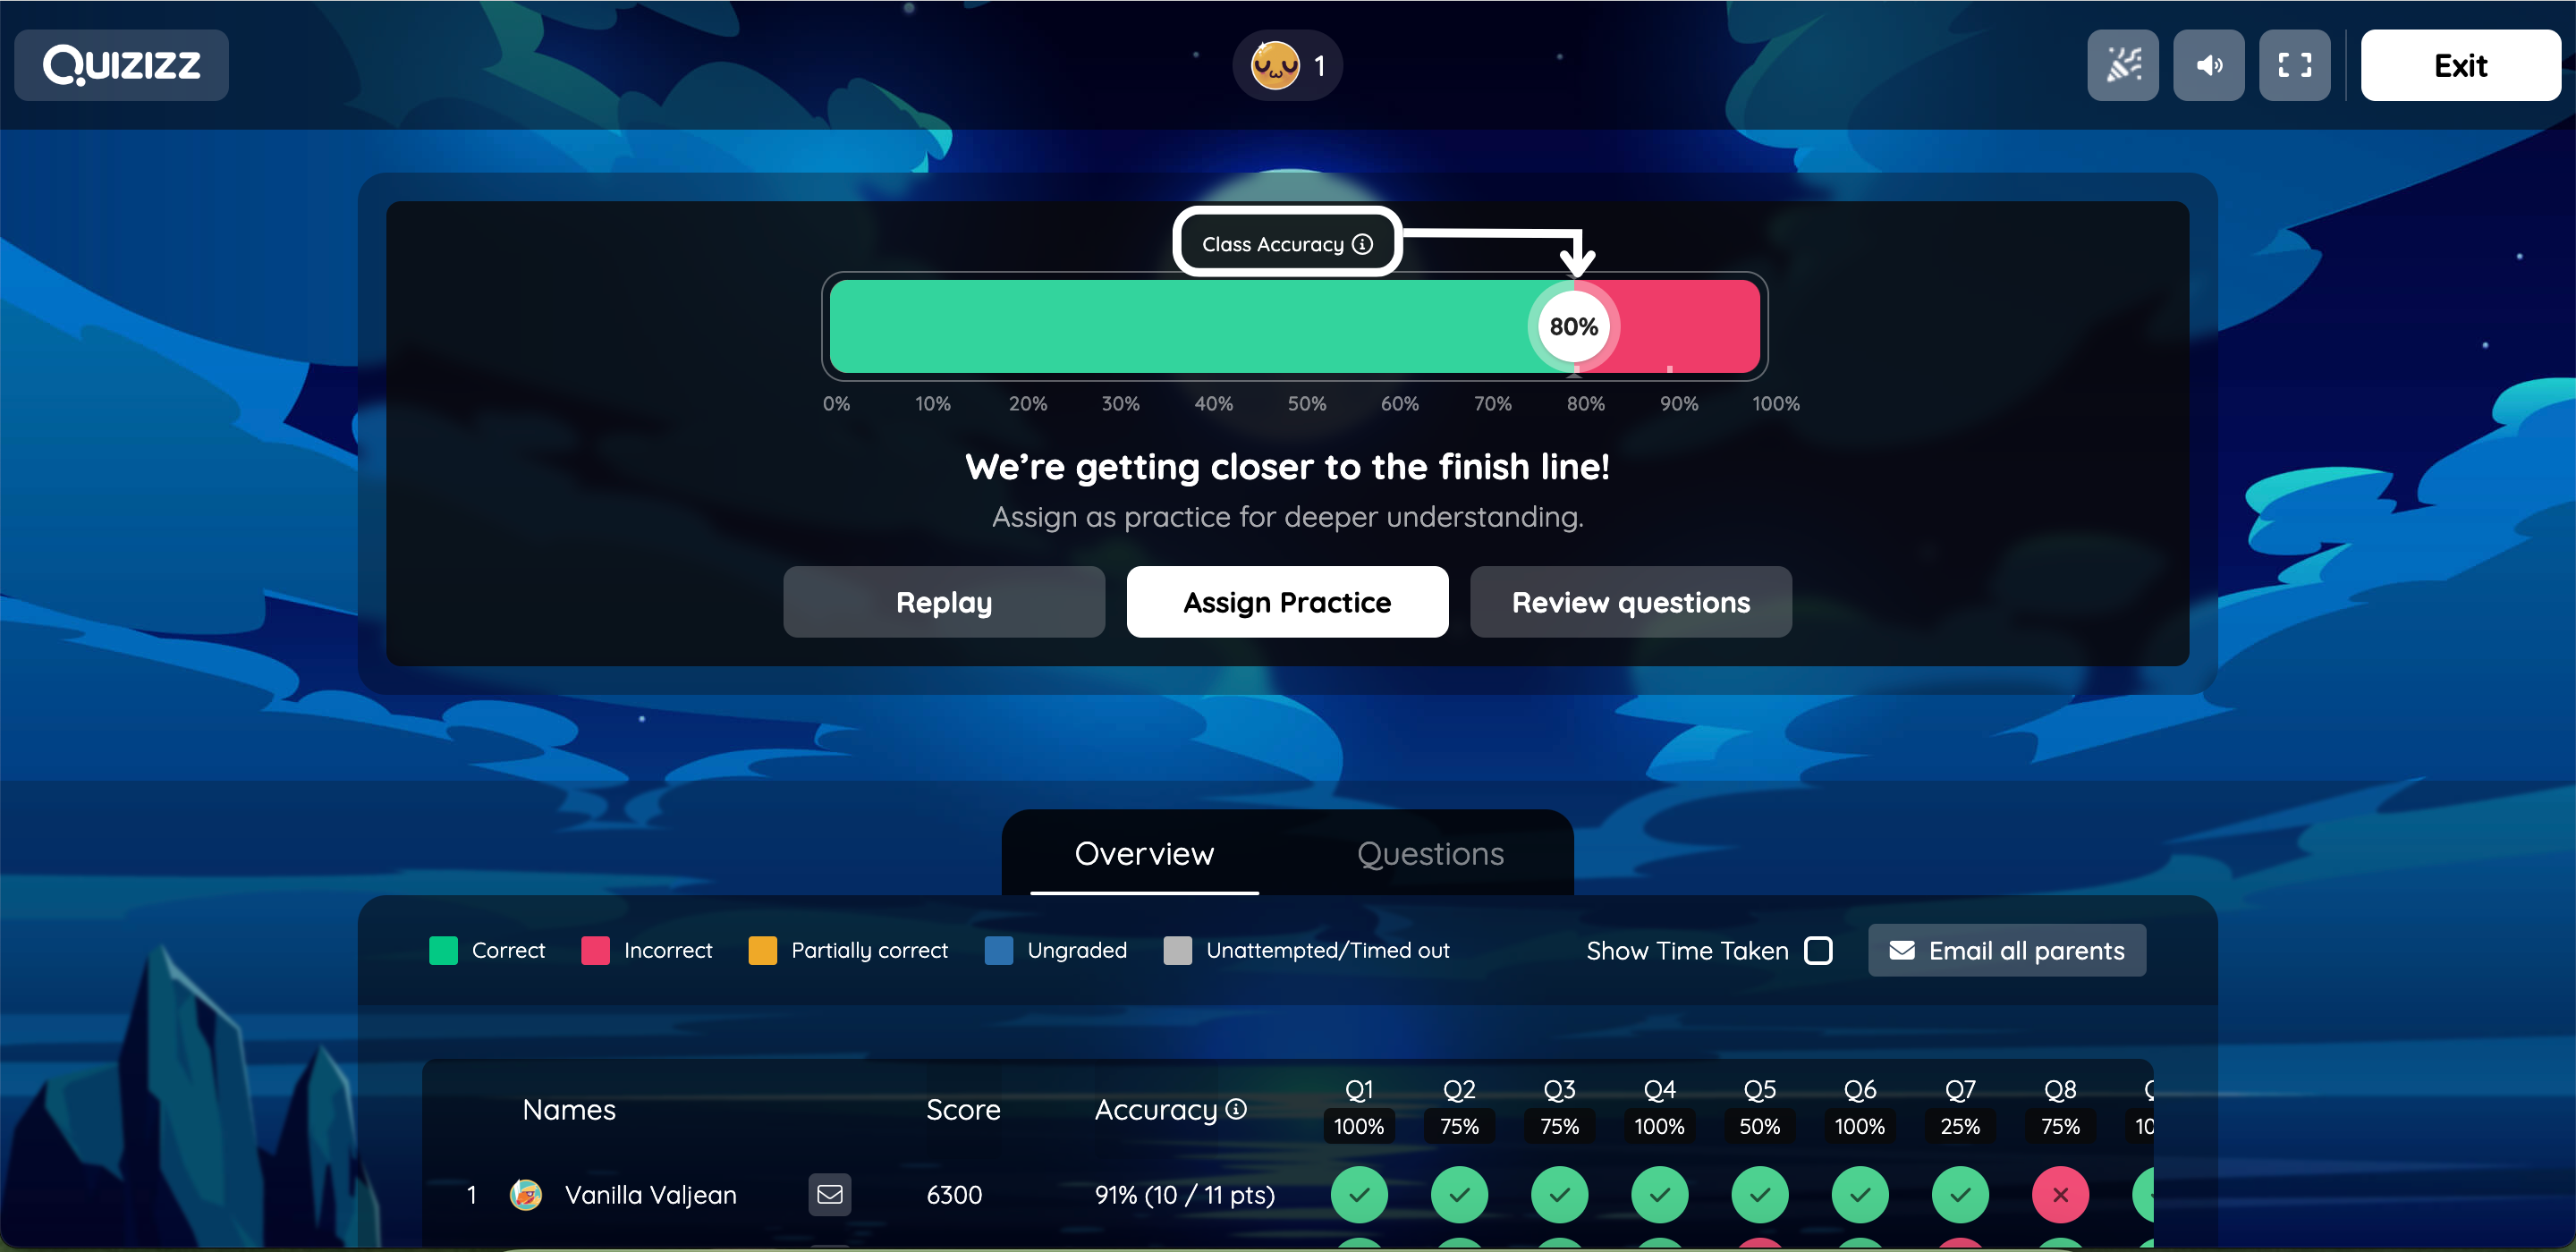
The Overview tab will display both the scores and the accuracy points for each of your students. Accuracy will also be represented in percentages here.
If you switch to the 'Questions' tab, you can get detailed information on your students' performance in each question. Here, you can choose to display questions in decreasing order of accuracy by checking the 'Sort by Accuracy' box.
At the end of the session students will be shown a summary screen that displays their accuracy in points and percentages, their score, and their rank on the leaderboard. Take a look at an example below.

Reports
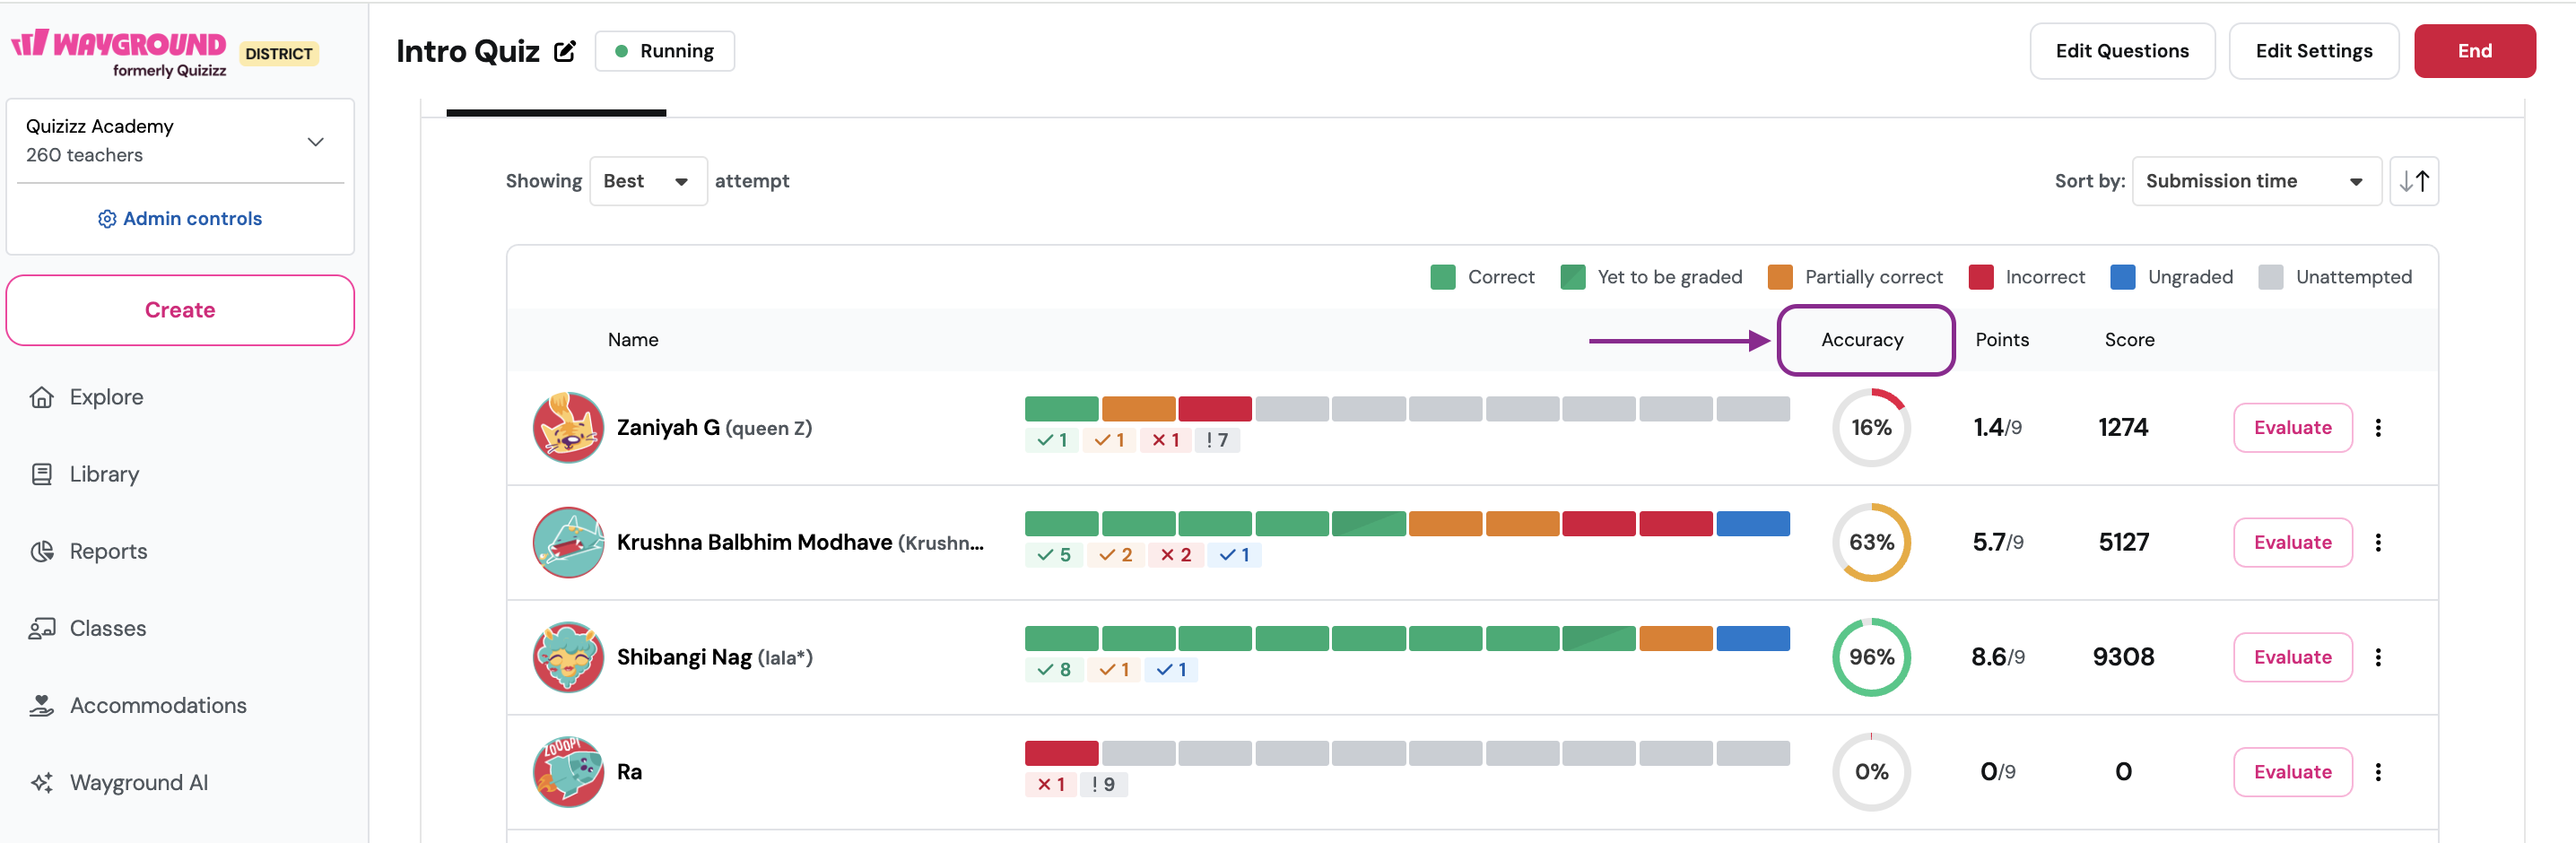
A report is automatically generated for every session that you conduct on Wayground. Click on 'Reports' on the left navigation pane and select the report you would like to view. Here's what a report for a live session conducted in Classic mode looks like.

The class accuracy for the session is displayed at the top. If you scroll down, you can see the accuracy percentages of each of your participants. You can also click on 'Sort by' and select 'Accuracy' to sort your students in ascending or descending order of accuracy.
Switch to the Questions tab for a detailed breakdown of student responses and accuracy percentages for each question. Or, switch to the Overview tab to look at the big picture of your session results. The 'Standards' tab will equip you with data that is aligned with the standards you may have tagged to your questions.
Was this article helpful?
That’s Great!
Thank you for your feedback
Sorry! We couldn't be helpful
Thank you for your feedback
Feedback sent
We appreciate your effort and will try to fix the article